Home | Previous | Next Lesson
This Lesson Can Be Printed See Instructions Below
Pivot Point Trading
You are going to love this lesson. Using pivot points as a trading strategy has been around for a long time and was originally used by floor traders. This was a nice simple way for floor traders to have some idea of where the market was heading during the course of the day with only a few simple calculations.
The pivot point is the level at which the market direction changes for the day. Using some simple arithmetic and the previous days high, low and close, a series of points are derived. These points can be critical support and resistance levels. The pivot level, support and resistance levels calculated from that are collectively known as pivot levels. Every day the market you are following has an open, high, low and a close for the day (some markets like forex are 24 hours but generally use 5pm EST as the open and close). This information basically contains all the data you need to use pivot points. |
The reason pivot points are so popular is that they are predictive as opposed to lagging. You use the information of the previous day to calculate potential turning points for the day you are about to trade (present day).
Because so many traders follow pivot points you will often find that the market reacts at these levels. This give you an opportunity to trade.
Before I go into how you calculate pivot points, I just want to point out that I have put an online calculator and a really neat desktop version that you can download for free HERE
If you would rather work the pivot points out by yourself, the formula I use is below:
Resistance 3 = High + 2*(Pivot - Low)
Resistance 2 = Pivot + (R1 - S1)
Resistance 1 = 2 * Pivot - Low
Pivot Point = ( High + Close + Low )/3
Support 1 = 2 * Pivot - High
Support 2 = Pivot - (R1 - S1)
Support 3 = Low - 2*(High - Pivot)
As you can see from the above formula, just by having the previous days high, low and close you eventually finish up with 7 points, 3 resistance levels, 3 support levels and the actual pivot point.
If the market opens above the pivot point then the bias for the day is long trades. If the market opens below the pivot point then the bias for the day is for short trades.
The three most important pivot points are R1, S1 and the actual pivot point.
The general idea behind trading pivot points are to look for a reversal or break of R1 or S1. By the time the market reaches R2,R3 or S2,S3 the market will already be overbought or oversold and these levels should be used for exits rather than entries.
A perfect set would be for the market to open above the pivot level and then stall slightly at R1 then go on to R2. You would enter on a break of R1 with a target of R2 and if the market was really strong close half at R2 and target R3 with the remainder of your position.
Unfortunately life is not that simple and we have to deal with each trading day the best way we can. I have picked a day at random from last week and what follows are some ideas on how you could have traded that day using pivot points.
On the 12th August 04 the Euro/Dollar (EUR/USD) had the following:
High - 1.2297
Low - 1.2213
Close - 1.2249
This gave us:
Resistance 3 = 1.2377
Resistance 2 = 1.2337
Resistance 1 = 1.2293
Pivot Point = 1.2253
Support 1 = 1.2209
Support 2 = 1.2169
Support 3 = 1.2125
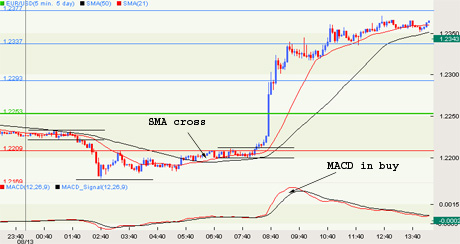
Have a look at the 5 minute chart below
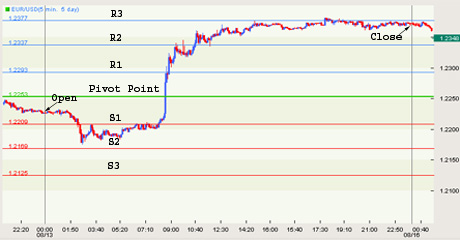
The green line is the pivot point. The blue lines are resistance levels R1,R2 and R3. The red lines are support levels S1,S2 and S3.
There are loads of ways to trade this day using pivot points but I shall walk you through a few of them and discuss why some are good in certain situations and why some are bad.
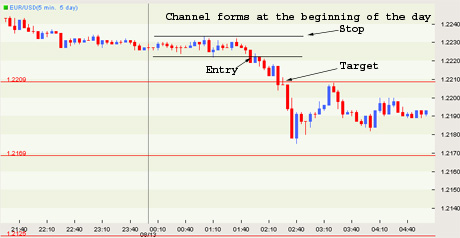
The Breakout Trade
At the beginning of the day we were below the pivot point,
so our bias is for short trades. A channel formed so you would
be looking for a break out of the channel, preferably to the
downside. In this type of trade you would have your sell entry
order just below the lower channel line with a stop order
just above the upper channel line and a target of S1. The
problem on this day was that, S1 was very close to the breakout
level and there was just not enough meat in the trade (13
pips). This is a good entry technique for you. Just because
it was not suitable this day, does not mean it will not be
suitable the next day.
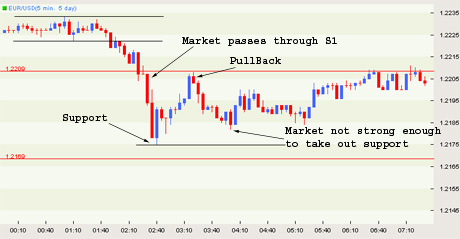
The Pullback Trade
This is one of my favorite set ups. The market passes through
S1 and then pulls back. An entry order is placed below support,
which in this case was the most recent low before the pullback.
A stop is then placed above the pullback (the most recent
high - peak) and a target set for S2. The problem again, on
this day was that the target of S2 was to close, and the market
never took out the previous support, which tells us that,
the market sentiment is beginning to change.
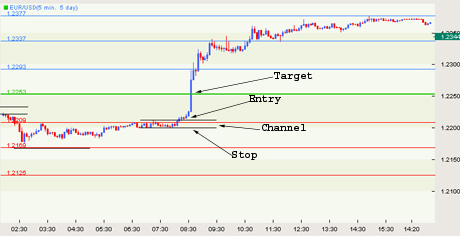
Breakout of Resistance
As the day progressed, the market started heading back up
to S1 and formed a channel (congestion area). This is another
good set up for a trade. An entry order is placed just above
the upper channel line, with a stop just below the lower channel
line and the first target would be the pivot line. If you
where trading more than one position, then you would close
out half your position as the market approaches the pivot
line, tighten your stop and then watch market action at that
level. As it happened, the market never stopped and your second
target then became R1. This was also easily achieved and I
would have closed out the rest of the position at that level.
Advanced
As I mentioned earlier, there are lots of ways to trade with
pivot points. A more advanced method is to use the cross of
two moving averages as a confirmation of a breakout. You can
even use combinations of indicators to help you make a decision.
It might be the cross of two averages and also MACD must be
in buy mode. Mess around with a few of your favorite indicators
but remember the signal is a break of a level and the indicators
are just confirmation.
We haven't even got into patterns around pivot levels or failures but that is not the point of this lesson. I just want to introduce another possible way for you to trade.
Good Trading
Best Regards
Mark McRae
Information, charts or examples contained in this lesson are for illustration and educational purposes only. It should not be considered as advice or a recommendation to buy or sell any security or financial instrument. We do not and cannot offer investment advice. For further information please read our disclaimer.
![]() To PRINT or save a copy of this lesson in PDF format simply
click the PRINT link. This will open the lesson in a PDF format which, you can
then PRINT. If
you are unfamiliar with PDF or don't have a FREE copy of Arobat
Reader see instructions.
To PRINT or save a copy of this lesson in PDF format simply
click the PRINT link. This will open the lesson in a PDF format which, you can
then PRINT. If
you are unfamiliar with PDF or don't have a FREE copy of Arobat
Reader see instructions.