Home | Previous | Next Lesson
This Lesson Can Be Printed See Instructions Below
Moving Linear Regression
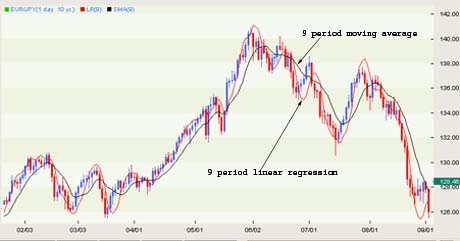
The moving linear regression indictor is a great little tool that can help you get into and out of the market faster. There are two main types of linear regression: the linear regression trend line and the moving linear regression. Both use the "least squares" method to plot certain points. That simply means, minimizing the distance between two points to give you the least value. Although it looks just like a moving average on a chart, it reacts much faster. Have a look the chart below.
|
Greatest Annual Percent Fall In The Dow Jones
The biggest annual decline in the Dow Jones Industrial
Average took place when the average closed at 77.90 points
on December 31, 1931. This was 52.6% lower than at the beginning
of the year.
Source: Guinness World Records
There are lots of possibilities for using a moving linear regression but the most common is when it crosses some other average.
As an example, set up your charts with a 12 period simple moving average of the highs and a 12 period simple moving average of the lows. Then set the moving linear regression to 21.
When the 21 period moving linear regression crosses above the 12 period moving average of the highs, that creates a buy signal. When the 21 period linear regression crosses below the 12 period simple moving average of the highs, that is the exit. The opposite is true for short trades. Have a look at the next chart.
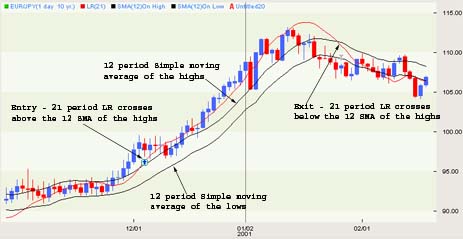
The disadvantage of using the moving linear regression is that unless you use some kind of filter, it is prone to a lot of whipsaw. The little 12 period channel helps take some of that away but you could also experiment with using RSI, MACD or stochastic as a filter.
Economic Calendar Terms
PPI
Relevance: This is important. (4) Scale of 1-5
Source: U.S. Department of Labor, Bureau of Labor statistics.
Scheduled Release Time: Information on the previous month
released at 8:30 ET around the 11th of every month
Producer Price Index measures prices of goods at the wholesale level. The three main categories that make up the PPI are: crude, intermediate, and finished, the most important of which is the finished goods index. This is the price of goods that are ready for sale to the user.
Traders' Glossary
Buy On Close
To buy at the end of a trading session
Cabinet Trade
Allows options traders to close deep out-of-the-money options
by trading the option at a price equal to one-half tick. Also
known as (CAB).
CFTC
The Commodities Futures Trading Commission. Regulates the
commodities futures industry in the U.S.
Stop Order
An order placed above or below the current market price to
protect further loses.
The Close
The last closing price or range at the end of a trading session
in a particular market. For markets that are 24 hours, it
usually means the end of the 24 hour period.
Good Trading
Best Regards
Mark McRae
Information, charts or examples contained in this lesson are for illustration and educational purposes only. It should not be considered as advice or a recommendation to buy or sell any security or financial instrument. We do not and cannot offer investment advice. For further information please read our disclaimer.
![]() To PRINT or save a copy of this lesson in PDF format simply click the PRINT link. This will open the lesson in a PDF format
which, you can then PRINT.
If you are unfamiliar with PDF or don't have a FREE copy of
Arobat Reader see instructions.
To PRINT or save a copy of this lesson in PDF format simply click the PRINT link. This will open the lesson in a PDF format
which, you can then PRINT.
If you are unfamiliar with PDF or don't have a FREE copy of
Arobat Reader see instructions.