Home | Previous | Next Lesson
This Lesson Can Be Printed - See Instructions Below.
Double Tops & Bottoms
Double tops and double bottoms appear frequently in nearly every market and time frame and are great indicators of a potential trend reversal. I like this type of patterns as it offers a logical entry and exit point and often reaches the price objective quickly. As the name implies this pattern consists of two peaks of roughly equal height for the double top formation and two troughs of roughly equal depth for the double bottom formation.
Double tops are sometimes called ''M's'' and double bottoms ''W's'', as the pattern resembles each of these letters. Both are reversal patterns and the stronger the preceding trend the more important the reversal when it happens. My research indicated that double tops tend to be shorter in duration and the break down more pronounced. Double bottoms on the other hand tend to be longer in duration and the price action tends to be in a smaller range.
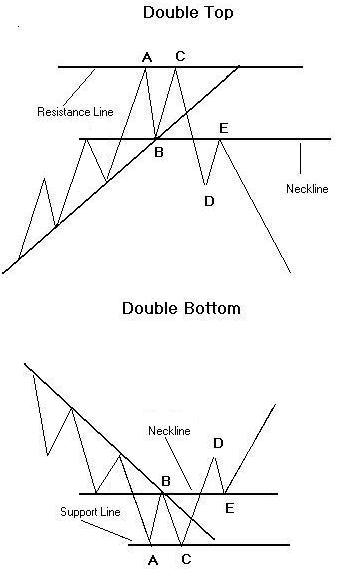
In the first example of a double top (see chart) a trend preceded the formation. The trend met resistance at point A and then declined to point B. From point B a new attempt at the resistance line was made and failed, this is the set up. The next and most important part of the pattern is that it breaks the neckline and closes below the neckline. It is important that the neckline is broken on a closing basis as up until this point the market might merely be in consolidation. Once the neckline is broken you now have two choices. You can enter the market straight away or wait to see if the market returns to the neckline and test the newly formed resistance. I like to enter the market on a break and add to my position if the market does return to the neckline. |
So now we have a break in the neckline and enter the market. Depending on the distance between B and C you can either place your stop loss order somewhere between B and C or above C if its not to expensive.
Now that the stop loss is in place, we need a target. The best way to project a price objective for this pattern is to measure the distance between B the neckline that has just been broken and C the previous resistance. As an example we will assume B was 85 and C was 115. If you subtract B from C you get 30. Now take 30 from the original neckline of 85 and your target is 55. The same rules apply to the double bottom only in the opposite direction. You simply add the difference between B and C to find your price objective.
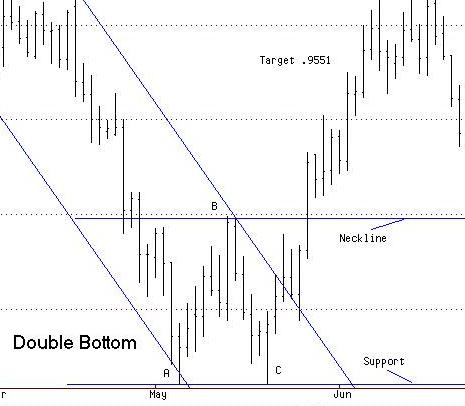
In the example of the double bottom on the daily cash Euro/Dollar (see last chart), B was .9197 and C was .8843. If you subtract C from B you get .0354. Add this to the break of the neckline of .9197 and you get a target of .9551, which was easily reached. In this example there was no pullback.
Good Trading
Mark McRae
PS. Don't for get to check out our bookstore at http://www.surefire-trading.com/
Information, charts or examples contained in this lesson are for illustration and educational purposes only. It should not be considered as advice or a recommendation to buy or sell any security or financial instrument. We do not and cannot offer investment advice. For further information please read our disclaimer.
![]() To PRINT or save a copy of this lesson in PDF format simply click the PRINT link. This will open the lesson in a PDF format which, you can then PRINT. If you are unfamiliar with PDF or don't have a FREE copy of Arobat Reader see instructions.
To PRINT or save a copy of this lesson in PDF format simply click the PRINT link. This will open the lesson in a PDF format which, you can then PRINT. If you are unfamiliar with PDF or don't have a FREE copy of Arobat Reader see instructions.