Home | Previous | Next Lesson
his Lesson Can Be Printed - See Instructions Below.
Relative Strength Index
History
Relative Strength Index was developed by J.Welles Wilder Jr. and introduced in his book 'New Concepts In Technical Trading Systems'. It is one of the most popular technical tools around. Relative strength Index (RSI) is measured on a scale from 0-100 with a reading above 70 being overbought and a reading below 30 being oversold. Originally he recommended a 14-day period as the setting but many other time periods have now become popular. Wilder discusses 5 uses of RSI in his book.
Tops and Bottoms Failure Swings Support and Resistance |
My Use Of RSI
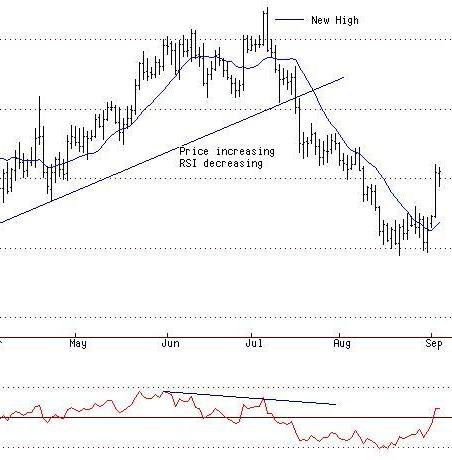
My own favorite use of RSI is that of divergence. When the security you are trading makes a new high and the RSI turns down that is bearish divergence.
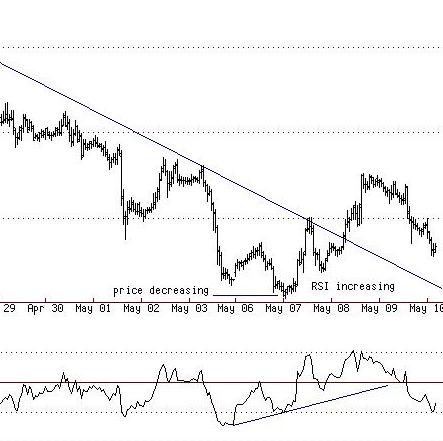
The same is true of bullish divergence. When price makes a new low and the RSI turns up that is bullish divergence.
I also prefer to see divergence at major tops and bottoms. That is to say, if we have been in an up trend for some time and I am already thinking this might be topping and I see divergence then I am a lot more confident that it has in fact topped and vice versa.
I don't like to use RSI as a sole trigger for a new position but rather I like to use it in combination with other indicators to help build a picture. You will notice that in most cases of divergence the security makes a low as does the RSI, then the RSI begins to turn up but the security continues down. The same applies to highs.
Now the security makes a new low and the RSI does come down but not as low as the previous low and that is the point where action can be taken. The fact that the RSI has not dropped lower than its previous low and the price has, is the point of recognition. If I also have a break of a trend line or it has reach a projection or some other confirming analysis then I would enter a trade.
As you can see from the two charts below one is exhibiting bearish divergence and the other bullish divergence. In both cases it signified the end of a trend.
USD/CHF
USD/CHF
Good Trading
Mark McRae
PS. Don't for get to check out our bookstore at http://www.surefire-trading.com/
Information, charts or examples contained in this lesson are for illustration and educational purposes only. It should not be considered as advice or a recommendation to buy or sell any security or financial instrument. We do not and cannot offer investment advice. For further information please read our disclaimer.
![]() To PRINT or save a copy of this lesson in PDF format simply click the PRINT link. This will open the lesson in a PDF format which, you can then PRINT. If you are unfamiliar with PDF or don't have a FREE copy of Arobat Reader see instructions.
To PRINT or save a copy of this lesson in PDF format simply click the PRINT link. This will open the lesson in a PDF format which, you can then PRINT. If you are unfamiliar with PDF or don't have a FREE copy of Arobat Reader see instructions.