Home | Previous | Next Lesson
This Lesson Can Be Printed See Instructions Below
Commodity Channel Index
by Suniiel A Mangwani
The Commodity Channel Index (CCI) developed by Donald Lambert, is an indicator designed to identify cyclical turns in currencies or commodities. It is a momentum indicator that determines how far the current price has been from the recent average.
In its basic use, the CCI can be used in 2 ways -
|
Lambert's trading guidelines for the CCI focused on movements above +100 and below -100 to generate buy and sell signals. Because about 70 to 80 percent of the CCI values are between +100 and -100, a buy or sell signal will be in force only 20 to 30 percent of the time. When the CCI moves above +100, a market is considered to be entering into a strong uptrend and a buy signal is given. The position should be closed when the CCI moves back below +100. When the CCI moves below -100, the security is considered to be in a strong downtrend and a sell signal is given. The position should be closed when the CCI moves back above -100.
Most charting software's include the CCI, as a single line oscillating around the centre zero line.
Besides looking for divergences, and overbought/oversold values, I use the CCI (with a setting of 14 periods) to derive signals in 2 different ways -
- Zero line crossovers - When the CCI is above the zero line, it is a signal that the overall trend is upwards, and hence we are looking for long trades. If you think back to what the CCI measures, this is common sense because it means the price is staying above its moving average.
-
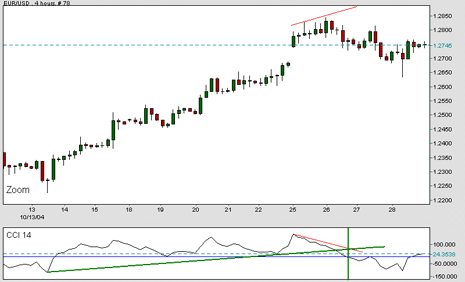
Trend line breaks - Trend
lines can be drawn connecting the peaks and troughs
of the CCI. When the CCI breaks a trend line, it
confirms the change in trend. Usually the break
of the CCI trend line actually occurs before the
price breaks upwards - hence the CCI often being
referred to as a leading indicator. This is where
the CCI really helps us by clearly showing what
wouldn't be obvious by looking at the price/MA combination
alone. Plus if one end of the trend line is in the
(+) (-) 100 region, it gives the signal more validity.
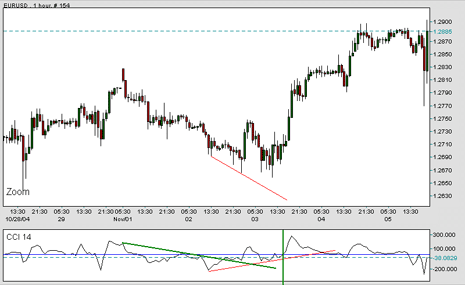
Notes on attached charts
- Eur/Usd. 1 hour.
- Red line indicates positive divergence in a downtrend, indicating a possible change in trend.
- Green trend line - CCI breaks the trend line, which becomes the line of resistance turned support.
- Entry is confirmed with CCI crossing zero line at 1530 ( Indicated by green vertical line)

|

Good Trading
Best Regards
Mark McRae
Information, charts or examples contained in this lesson are for illustration and educational purposes only. It should not be considered as advice or a recommendation to buy or sell any security or financial instrument. We do not and cannot offer investment advice. For further information please read our disclaimer.
![]() To PRINT or save a copy of this lesson in PDF format
simply click the PRINT link. This will open the lesson in a PDF format which,
you can then PRINT.
If you are unfamiliar with PDF or don't have a FREE
copy of Arobat Reader see instructions.
To PRINT or save a copy of this lesson in PDF format
simply click the PRINT link. This will open the lesson in a PDF format which,
you can then PRINT.
If you are unfamiliar with PDF or don't have a FREE
copy of Arobat Reader see instructions.