Home | Previous | Next Lesson
This Lesson Can Be Printed - See Instructions Below.
ADX (Average Directional Index)
History
Average Directional Index (ADX) was developed by J. Welles Wilder Jr. and as its name implies attempts to measure the strength of the direction the security is moving in.
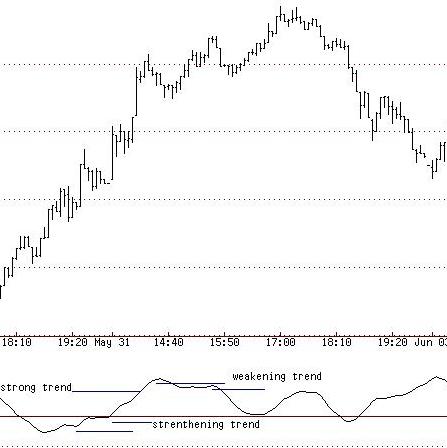
ADX is measured in a scale from 0-100 with readings above 25 indicating that you are in a trend whilst readings below 25 indicate that you are not in a trend. As the scale is measured from 0-100 it doesn't matter if the trend is up or down, the scale and reading are still from 0-100 e.g. if you were in a strong down trend the reading might be 45. You might get the exact same reading if you were in a strong up trend. The reason I mention this is that many of my students get confused when first introduced to ADX and see the indicator rising as the trend goes down (see chart below). |
DJIA
Wilder himself admitted that ''Directional movement is the most fascinating concept I have ever studied'' 'New Concepts In Technical Trading Systems'. Readings of over 60 are fairly rare in my observations and once they are at the extremes can actually mean the direction is getting ready for a change.
My Own use Of ADX
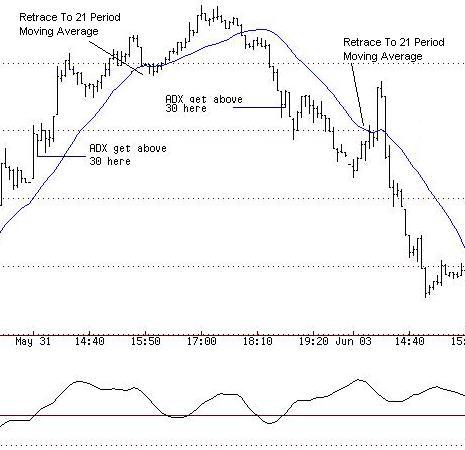
I highly recommend this little technique. You may not get that many signals but when you do they will be high probability. I like to use a 21 period moving average on the time period I am trading.
First the ADX must be 30 or over, no action is taken unless the ADX has achieved this reading.
Next the security must retrace to its 21 period moving average.
Once these two conditions have been met you can enter the market. Once in the market keep two things in mind. Have a tight stop on the initial entry, perhaps above the most recent high or most recent low depending on direction you are trading or even a dollar amount.
Next, be aware of the last high or low once in trade e.g. the ADX has a reading 30 or above, the security makes a high and then retraces to the 21 period moving average. Your first target should be the last high or you should at least pay close attention to what happens to price around that level.
The same goes for the short trade. You have a reading of 30 or above and it makes a new low. It then pulls back to the 21 period moving average and you enter short. Your first target should be the previous low or monitor closely at that price level.
Good Trading
Mark McRae
PS. Don't for get to check out our bookstore at http://www.surefire-trading.com/
Information, charts or examples contained in this lesson are for illustration and educational purposes only. It should not be considered as advice or a recommendation to buy or sell any security or financial instrument. We do not and cannot offer investment advice. For further information please read our disclaimer.
![]() To PRINT or save a copy of this lesson in PDF format simply click the PRINT link. This will open the lesson in a PDF format which, you can then PRINT. If you are unfamiliar with PDF or don't have a FREE copy of Arobat Reader see instructions.
To PRINT or save a copy of this lesson in PDF format simply click the PRINT link. This will open the lesson in a PDF format which, you can then PRINT. If you are unfamiliar with PDF or don't have a FREE copy of Arobat Reader see instructions.