Home | Previous | Next Lesson
This Lesson Can Be Printed See Instructions Below
STARC Bands
In this lesson we are going to look at a trading method using "STARC" bands. I have been experimenting with these bands for a few weeks now and I think they have some real potential as a trading method.
Who Is The Worlds Richest Investor? Finding entry and exit points using some form of bands around price have been used for trading for many years. I like starc bands because they are based on the Average True Range (ATR), as opposed to a simple average. The name "starc" is derived from the inventor Manning Stoller Average Range Channel (STARC).
|
Stoller originally used a 15 period ATR that is double or subtracted from a 5 or 6 period moving average.
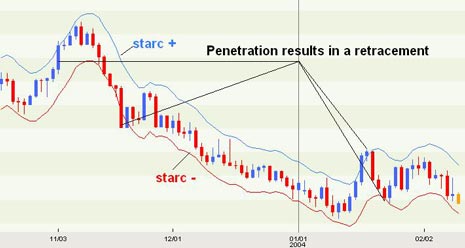
The upper band is known as starc + and the lower and is known as starc -. Regardless of how you use these bands they are well worth watching, if for no other reason than to stop you entering the market at the wrong place.
It is uncommon for price to exceed the starc bands. Therefore, when it does, it is a warning signal. You would not enter any short position when the price has closed below or is close the lower starc band. It would also not be wise to consider entering any long positions when the price has closed above or is close to the upper band. Have a look at the first chart.
Now as my long term subscribers know - I always like to look for different uses for indictors and this is no exception. I like to have the ATR set at 21 and the MA set at 13. I also like to add a 13 period moving average as the center line. This results in more instances where price actually passes through the bands.
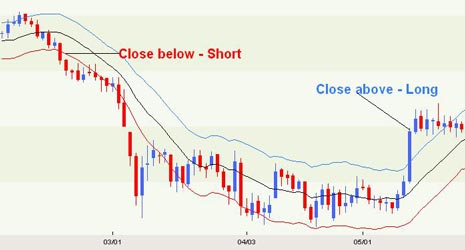
If you mess around with the bands for any length of time, you will notice that when there is a close above or very close to the upper band after it has been in a downtrend then the price tends to stay in that direction (up) until there is a close below or near the lower band. Look at the next chart:
As you can see from the chart above there is usually a fair period of time between the setup changing from long to short. This gives us a trading opportunity. Here is what I have been working with: Once the chart set's up with a penetration of one of the bands, watch for the retracement for an entry.
As you can see from the chart above there is usually a fair period of time between the setup changing from long to short. This gives us a trading opportunity. Here is what I have been working with: Once the chart set's up with a penetration of one of the bands, watch for the retracement for an entry.
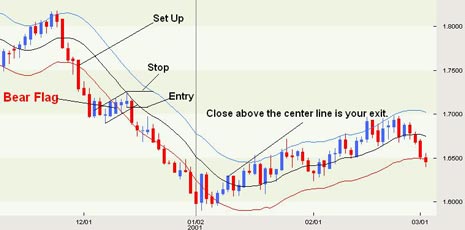
The last chart, is a trade. The set up was when the red candle closed below the lower starc band. Next, we need to wait for a retracement. The actual retracement formed a little bear flag (sloping rectangle), which allowed us to draw some trend lines. The entry can be made in one of two ways. As price makes its way back to the center line, you could follow the low of each candle with an entry order or you can enter on a breach of the lower bear flag trend line.
As it happened, the breach of the trend line and the low of the candle happened at almost the same time. Once entered, you can place a stop loss above the peak or high of the entry bar. This only leaves a target. Once in the trade I like to use the center line as stop loss. If we have a close above the center line, then it is time to exit. You could also measure the distance between the two lines of the bear flag and project it down. The only reason I didn't use that method on this particular trade was that a flag projection down would have taken me past the most recent low, which was past support. If the bear flag projection down had been higher than the most resent support then I would have used that method as a target.
Play around with starc bands. I am sure that they will help you in your trading.
Economic Calendar Terms
Retail Sales
Relevance: This is an important release. (5) Scale Of 1-5
Source: The Census Bureau of the Department of Commerce. Scheduled
Release Time: Normally around 13th of the month at 8:30 ET.
This release measures the total receipts of retail stores.
This particular indictor is always widely followed as a good
indictor of consumer spending patterns. A change plus or minus
in the Retails Sales is often a result of the components of
the report changing in price as opposed to actual changes
in consumer
spending habits.
Traders' Glossary
Bull
Someone who expects the market to rise. Trades from the long
side.
Bull Market
A market in which prices are rising. A succession of higher
peaks and higher valleys.
Day Order
An order that is placed during the day that is good only for
that day trading session. If the order can not be filled then
the order is automatically canceled.
Open Order
An order placed with you broker which remains in place until
it is executed or canceled.
Spread
The difference in price between the bid (buy) and offer (sell.)
Good Trading
Best Regards
Mark McRae
Information, charts or examples contained in this lesson are for illustration and educational purposes only. It should not be considered as advice or a recommendation to buy or sell any security or financial instrument. We do not and cannot offer investment advice. For further information please read our disclaimer.
![]() To PRINT or save a copy of this lesson in PDF format simply click the PRINT link. This will open the lesson in a PDF format
which, you can then PRINT.
If you are unfamiliar with PDF or don't have a FREE copy of
Arobat Reader see instructions.
To PRINT or save a copy of this lesson in PDF format simply click the PRINT link. This will open the lesson in a PDF format
which, you can then PRINT.
If you are unfamiliar with PDF or don't have a FREE copy of
Arobat Reader see instructions.