Home | Previous | Next Lesson
This Lesson Can Be Printed See Instructions Below
Momentum Trading
One of the most basic and widely used indicators is that of momentum.
Before I go on to tell you how we can use the momentum indicator to trade with, I want to explain the difference between a leading and a lagging indictor.
Nearly all indicators are lagging indicators. That is to say that the price must first move in order for the indicators to react. So you will inevitable get a situation e.g. where the market will rise shortly followed by the indicator. This is where the term lagging comes form in trading. On the other hand, an indictor that forecasts the move before it happens is called a leading indictor. If for example the indictor peaks and then turns down before price peaks and turns down then that would be a leading indictor. You can use most indicators as both depending on how you
mix them
|
Let's first talk about what a momentum indictor is - simply a visual reference point of whether a security is rising or falling and how fast that rise or fall is.
Construction of the indictor is simple - just subtract the close of the security X (whatever period you want)days ago from today's close.
The resulting number can then be plotted around a zero line. For example let's say we were looking at a 10 period momentum indictor. You would simply deduct today's close from the close 10 days ago. If the close was higher than the close 10 days ago then it would be plotted above the zero line. If on the other hand the close was lower than the close 10 days ago, the it would be plotted below the zero line.
As you would expect - if the momentum line is rising and above the zero line we can interpret that as a strong bullish trend. If the momentum line is below the zero line and falling we can interpret that as a strong bearish trend.
As you can see from our first chart, momentum can be a very good confirmation indictor. If you were using a moving average or a trend line to help determine trend, then a cross above or below the zero line could be just the confirmation you need.
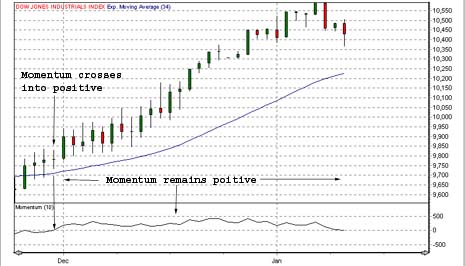
In the example above I was using a 34 period exponential average of the close. Price came back up and closed above the average and shortly afterwards the momentum indictor also closed above the zero line confirming the move. Not only that but the momentum line has remained above the zero line since the cross over. This would give you confidence that the trend is still in force.
In our next chart there are two important points I want you to take note of - the first is that of divergence.
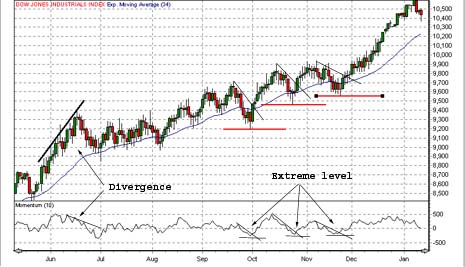
Divergence is when an indictor does the opposite of what the price on the chart is doing. In our example the momentum indictor started to turn down but the price continued up. This is bearish divergence. Often when this happens it is an early warning that the market is in an exhaust move. The indictor is giving us an advanced warning that the market might be getting ready for a move in the opposite direction from which it was previously heading. The opposite is obviously true for bullish divergence.
Next I want you to look at the three points I have marked
as extreme on the chart. Forget the reading at these points
- visually you can see that the three points are lower than
the other points around them. When you have an extremely low
reading in an uptrend then you have a good trading opportunity
to go long. If you have an extremely high reading in a downtrend
then
you have a good opportunity to go short.
You could further confirm this by a shorter moving average crossing a longer average or as I have done with a little trend line. Nice, simple technique that will keep you on the right side of the trend and give you some great entry points.
Traders' Glossary
- Arbitrage - The simultaneously purchase and sale of identical securities to benefit from a discrepancy in their price.
- Ask - Also known as 'offer' - The price at which
traders are prepared
to sell a security. - Bear - Trader who believes prices will move lower.
- Bear Market - A market that is in decline (falling). A succession of lower peaks and valleys.
- Bid - The price at which traders are prepared to pay for a security.
Good Trading
Best Regards
Mark McRae
Information, charts or examples contained in this lesson are for illustration and educational purposes only. It should not be considered as advice or a recommendation to buy or sell any security or financial instrument. We do not and cannot offer investment advice. For further information please read our disclaimer.
![]() To PRINT or save a copy of this lesson in PDF format simply click the PRINT link. This will open the lesson in a PDF format
which, you can then PRINT.
If you are unfamiliar with PDF or don't have a FREE copy of
Arobat Reader see instructions.
To PRINT or save a copy of this lesson in PDF format simply click the PRINT link. This will open the lesson in a PDF format
which, you can then PRINT.
If you are unfamiliar with PDF or don't have a FREE copy of
Arobat Reader see instructions.