Home | Previous | Next Lesson
This Lesson Can Be Printed - See Instructions Below.
Moving Average Convergence-Divergence (MACD)
History
Moving Average Convergence-Divergence
(MACD) was originally constructed by Gerald Appel an analyst in New York. Originally designed for analysis of stock trends, it is now widely used in many markets. MACD is constructed by making an average of the difference between two moving averages. The difference of the original two moving averages and the moving average of the difference can be plotted as two lines, one fast and one slow.
Uses
Most modern charting software now includes MACD as standard. Once selected to display in your charting software it normally shows up as two lines plotted on an open scale against the zero line. These two lines will normally be of different color or one line a solid line and the other a dotted line. Frequently used settings are 12 and 26 period exponential moving averages with 9 period exponential moving average as the signal line.
Although there are three moving averages mentioned you will only see two lines. The simplest method of use is when the two lines cross. If the faster signal line crosses above the slower line then a buy signal is generated and vice versa. It is also used as an overbought and oversold indicator. The higher above the zero both lines are the more overbought it becomes and the lower below the zero line both lines are the more oversold it becomes.
It may also lead to a stronger signal if the signal line crosses down when it is overbought and crosses up when it is oversold. The last common use of MACD is that of divergence. If the MACD is making new lows and the price of the security is not making new lows that is one form of divergence (bullish divergence). Also, if the MACD has made a high and starts to head down but price continues up that is another type of divergence (bearish divergence) and may lead to an indication of a change in direction. |
My Own Use Of MACD
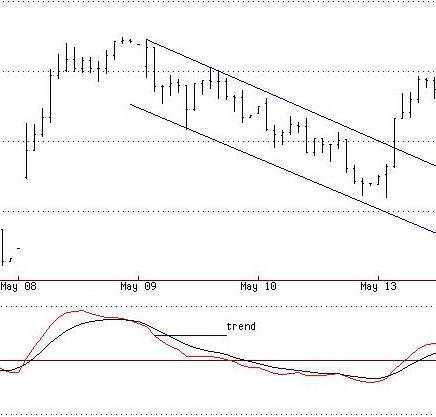
I like to use the MACD as a trend indicator with parameters set at 8 and 18 period exponential moving averages with a 9 period exponential moving average as the signal line. All I am trying to do is establish a trend in a higher time period than the one I intend to trade.
If you were trading day charts you would be looking at the MACD on the weekly. If you were trading an hourly chart you might look at the MACD on the daily. As long as the signal line remains above or below the MACD line on the next higher time frame you know the trend is still in place.
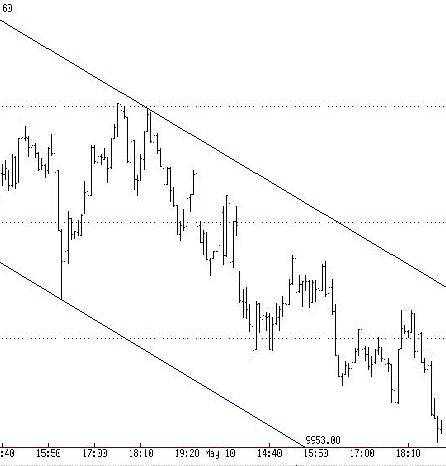
As you can see from the chart examples of the 30 min Cash DJIA there was a sell signal on the 9th May 02. This was my higher time frame as I was trading intraday. I then went to the 5 min chart of the Cash DJIA and sold the rallies, confident to stay short as long as my higher time period MACD trend in the 30 min stayed intact. If the 30 min MACD signal line were to cross up I would have closed all short positions.
30 Min Chart
5 Min Chart
Good Trading
Mark McRae
Information, charts or examples contained in this lesson are for illustration and educational purposes only. It should not be considered as advice or a recommendation to buy or sell any security or financial instrument. We do not and cannot offer investment advice. For further information please read our disclaimer.
![]() To PRINT or save a copy of this lesson in PDF format simply click the PRINT link. This will open the lesson in a PDF format which, you can then PRINT. If you are unfamiliar with PDF or don't have a FREE copy of Arobat Reader see instructions.
To PRINT or save a copy of this lesson in PDF format simply click the PRINT link. This will open the lesson in a PDF format which, you can then PRINT. If you are unfamiliar with PDF or don't have a FREE copy of Arobat Reader see instructions.