Home | Previous | Next Lesson
This Lesson Can Be Printed See Instructions Below
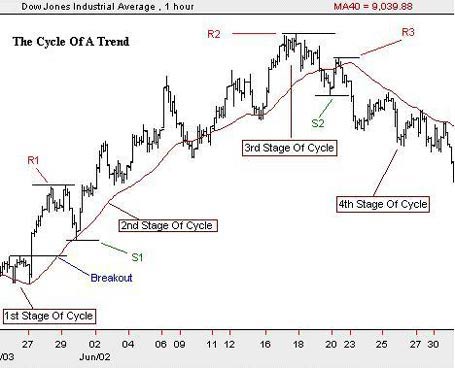
The Cycle Of A Trend
In this lesson we are going to look at the different stages of a trend and how it can help you position yourself for a trade.
It is commonly accepted that there are four stages of a trend. These stages make up a cycle and each cycle has smaller cycles contained within them. It doesn't matter whether you like to trade with 5-minute charts or monthly charts. Each market will be in some stage of the cycle as you are observing it. Before you even think about getting into a trade you should have some idea of where the market is in the cycle. This will help you avoid making the wrong entry. For example, if you have identified stage two of the cycle it doesn't make sense for you to be short in an up stage. |
If you look at the chart below you can see the 4 different stages clearly marked.
Stage One
The start of the cycle (stage one) is where there is very little happening and the market is generally flat. At this stage the market is normally oscillating in a certain range. As this stage ends you often see a breakout of the previous range. The breakout can often be explosive particularly if it has been in consolidation for a long period of time. For markets that can measure volume an increase of volume is an early indication that the breakout is real.
Stage Two
Stage two is after the breakout has occurred and we begin to head North. Depending on the force of the move the market may rally and not come back to the breakout point or it may come back and test that area.
In the chart example the market broke out of the range and then rallied to R1 where it began to retreat to S1. These two points are very important. If S1 were lower than the breakout point or S1 were to rally slight but still remain below R1 then break back down past S1 then the start of the cycle would be in doubt.
What actually happened was that the market came down to S1 and then rallied past R1. The aggressive trader would already have taken a position on the breakout and most likely add to the position as R1 was taken. If you had not entered the market yet then this would be an ideal opportunity to jump in.
The second point to note is that the moving average began to turn up after the breakout giving further support to the beginning of the cycle.
In the case of the chart example I have selected a simple 40 period moving average of the closes. You can use any moving average that suits the time frame you are dealing in.
Stage two continues making higher peaks and higher valleys and may come back to test the moving average a few times.
Stage Three
Stage three is the final thrust of the cycle. You may notice a spike or a double top formation as the trend begins to run out of steam.
In our example the top is fairly flat. R2 is formed and the market retreats to S2. What happens next is the opposite of the start of the cycle. The market stops at S2 and then rallies slightly. The fact that the rally did not exceed R2 is what is significant. Instead the market only reached R3.
As soon as the market broke through S2 it signified the end of the trend. You would also note that the moving average turned down at this point further give support to the end of the up move. If the top was not easily identifiable and positions closed at that time then once S2 was taken any long positions would have been closed.
Stage Four
This is the final stage of the cycle and perhaps the most interesting. Depending on market conditions some traders may now go short. A potential shorting point would have been on the break of S2. The market in our example is making lower valleys and lower peaks. This tells us that there is now a move to the downside.
Before initiating a short on the break of S2 you could measure the start of the whole move at the beginning of the cycle to where the market topped at stage three. You could then calculate the 61.8% retracement (see lesson on Fibonacci). This would give you a downside target to aim for and if there was enough meat left in the trade initiate a short trade.
Stage four can be difficult as the market may either go into consolidation again or continue down.
So how can this help your trading? Well, the first thing to do before you enter a trade is decide where in the cycle you are. If you are at stage two then it could be dangerous to go short. It could also be dangerous to enter short if stage two had been building for a long time. Remember the market can't go up for ever.
On the other hand if we were entering stage four you wouldn't want to be long. Just by identifying the different stages of the market it can help you lock in profits, make better judgments decisions on whether you should be in the market at all and perhaps give you clues for entry and exits.
Good Trading
Best Regards
Mark McRae
Information, charts or examples contained in this lesson are for illustration and educational purposes only. It should not be considered as advice or a recommendation to buy or sell any security or financial instrument. We do not and cannot offer investment advice. For further information please read our disclaimer.
![]() To PRINT or save a copy of this lesson in PDF format simply click
the PRINT link.
This will open the lesson in a PDF format which, you can
then PRINT. If
you are unfamiliar with PDF or don't have a FREE copy of
Arobat Reader see instructions.
To PRINT or save a copy of this lesson in PDF format simply click
the PRINT link.
This will open the lesson in a PDF format which, you can
then PRINT. If
you are unfamiliar with PDF or don't have a FREE copy of
Arobat Reader see instructions.