Home | Previous | Next Lesson
This Lesson Can Be Printed See Instructions Below
Intraday Trading Tactics
In this lesson I want to discuss intraday
tactics that you should be aware of when you start to trade
intraday.
By intraday I mean very short time frames such as 1 minute, 5 minute and 15 minute charts. This will apply to traders who actively trade and probably trade frequently during the course of the day.
Regardless of what technique you use to enter and exit the market this approach will aid you in deciding if you are on the wrong or right side of the market. The first thing you should do when trading intraday regardless of the security is to have some general idea of where the market has been recently. You cannot of course start the day with a strong directional bias. The reason you cannot start the day with a strong bias is that intraday the markets can be very volatile and if you have stubbornly decided the market will go one way and it starts to go another you will find it difficult to change direction. This is because you will try and convince yourself that the move against you is temporary. |
To overcome this directional bias I use the following discipline to help tell me when the market is doing something different from what I expect. To analyze the market first think of what happens in a typical up trend or down trend.
Let's say that in an up trend the last two-day have made higher highs and higher lows. The close has also been higher for the last two days.
In order for that little up trend to continue
what should happen?
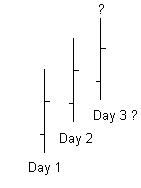
For the up trend to continue on day 3 you would expect a higher low, a higher high and a higher close right! So lets look at what should happen on the third day.
On day 3 I would first like to see a low in place in the
early part of the day. I often find that when an up trend
is continuing the low is made first. In a down trend I like
to see the high of the day made in the early part of the session.
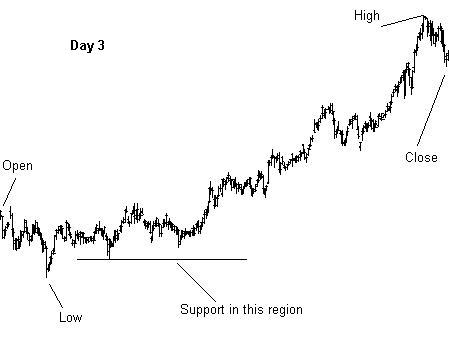
As you can see from the chart above of day 3. We had the open then early in the day a low was made. As the day progressed the high of the day was made towards the later part of the day and then finally the close.
So how does this information help me? Well, if for example the low of day three continued lower than the low of day 2 I would begin to wonder if the market was retracing or reversing.
If the low of day three took out the low of day 2 when I expected it not too I would stand aside until I had a clearer picture of where the market was headed. It may just be that the market will continue up after making a low lower than day 2 but why take the risk.
I also like to see the low of day 3 tested in some way. As you can see from the chart the low was made then the market made some progress upward and then came back down to near the newly formed low where it found support (buyers).
This for me is a great indication that there is some demand at that level and gives me an opportunity to enter the market with very little risk as I can place my stop under the newly formed low.
As openings can be volatile I like to watch the first 30 minutes to 60 minutes to see how the market is shaping up before taking a position. I start with no definite directional bias but I am aware of what has been happening in the last few days and if it does what I assume it will do then I am ready to take action.
If it does not do what I assume it will do then I know that I may have miss-read the market and am ready to rethink my tactics for the rest of the day. As you should know by now the market is always right so its OK to have an opinion but don't get married to it.
If the market takes out the low of day 2, stand aside and
rethink your approach for the rest of the day particularly
if the move is a strong move in the opposite direction from
where you thought the market would go.
The one thing you shouldn't do is wake up thinking that the
market is going up (or down) and just keeps trading in that
direction. Don't fight the market, it will always win. Just
go with the flow and realize when you are not going your way.
Good Trading
Best Regards
Mark McRae
Information, charts or examples contained in this lesson are for illustration and educational purposes only. It should not be considered as advice or a recommendation to buy or sell any security or financial instrument. We do not and cannot offer investment advice. For further information please read our disclaimer.
![]() To PRINT or save a copy of this lesson in PDF format simply click the PRINT link. This will open the lesson in a PDF format
which, you can then PRINT.
If you are unfamiliar with PDF or don't have a FREE copy of
Arobat Reader see instructions.
To PRINT or save a copy of this lesson in PDF format simply click the PRINT link. This will open the lesson in a PDF format
which, you can then PRINT.
If you are unfamiliar with PDF or don't have a FREE copy of
Arobat Reader see instructions.