Home | Previous | Next Lesson
This Lesson Can Be Printed See Instructions Below
Bollinger Bands Revealed
Bollinger bands are an integral part of just about every charting system I have ever seen but many traders are unfamiliar with how to use them. In this lesson we will cover the basics of Bollinger bands and one particular technique which I have found to be very reliable.
Bollinger Band History Bollinger Bands were invented by John Bollinger as a means of determining what could be considered as high or low around a give price. The bands are plotted at a standard deviation (statistical term for measuring volatility) around a moving average. Typically the standard deviation used is 2. The bands appear on charts as 3 bands.
|
For our examples we will use the most common setting of a 20 period simple moving average. This will give us 3 bands, the middle band of a 20 period simple moving average and the upper and lower bands calculated around the middle band with standard deviation of 2. The closing price is most commonly used to calculate the moving average.
Bollinger bands can be used to generate buy and sell signals but that is not their primary use. The main purpose of the bands are to:
- To identify areas of high and low volatility
- To identify periods when prices are at an extreme and possibly ready for a reversal.
- To identify a trending market.
See Chart Below
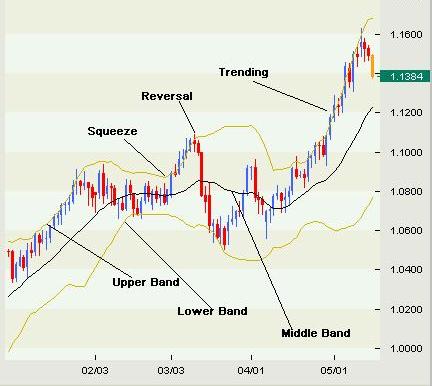
The squeeze (tightening) is a period of low volatility and often happens before a big move. It can also help identify potential breakout areas.
Reversal
In conjunction with other indicators you can identify potential reversal points.
Trending Following
Although Bollinger bands will not tell you when the trend has started if you combine it with certain indicators they will confirm the trend. It is also easily identifiable visually.
My Use Of Bollinger Bands
As I mentioned earlier Bollinger bands are not really meant to be used as a signal generating indicator but in conjunction with another indictors can be very useful.
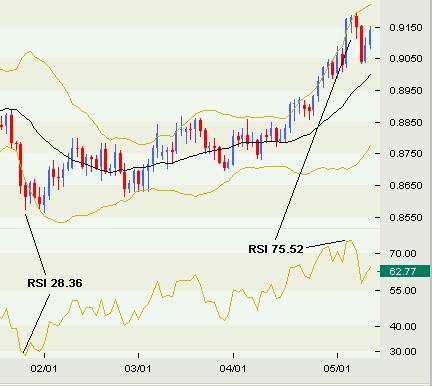
I like to use Bollinger bands and RSI together to generate possible buy and sell signals or to confirm overbought or oversold areas.
I normally set the RSI at 14 and when it reads over 70 and price is at or pushing through the upper band then I know we are overbought and ready for a reversal. I will either start thinking about shorting the market or if I am already in a long position will start to cover.
When the RSI reads below 30 and price is touching or pushing through the lower band then I know we are oversold and I will either consider buying the market or close existing short positions.
See Chart
Experiment with the settings until you find the right parameters for the market you are trading. I have found the bands to be effective on all time frames from 5 minutes to monthly bars.
Good Trading
Best Regards
Mark McRae
Information, charts or examples contained in this lesson are for illustration and educational purposes only. It should not be considered as advice or a recommendation to buy or sell any security or financial instrument. We do not and cannot offer investment advice. For further information please read our disclaimer.
![]() To PRINT or save a copy of this lesson in PDF format simply click the PRINT link. This will open the lesson in a PDF format which, you can then PRINT. If you are unfamiliar with PDF or don't have a FREE copy of Arobat Reader see instructions.
To PRINT or save a copy of this lesson in PDF format simply click the PRINT link. This will open the lesson in a PDF format which, you can then PRINT. If you are unfamiliar with PDF or don't have a FREE copy of Arobat Reader see instructions.